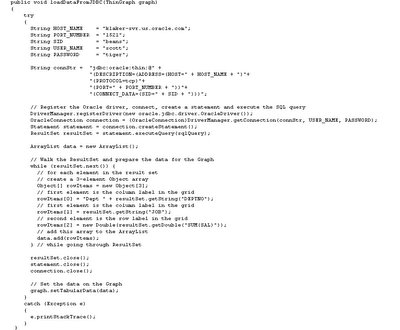
One of the largest threads currently running on the BI Beans forum relates to using BI Beans with non-OLAP data sources. Out of the box most of the BI presentation beans are wired to work with an OLAP data source. That OLAP data source can be derived from either a relational star/snowflake schema or an analytic workspace. The use of an OLAP data source against a relational schema requires additional metadata to be added in the form of registration of dimensions and cubes within the CWM repository.
In many cases the creation of this additional metadata may not be possible, so people have asked if it is possible to connect BI Beans to a non-OLAP data source. The answer is yes. The easiest way to do this is to use the BI Graph bean and connect this to an XML data source. This is relatively easy to do and as part of the BI Beans 10g samples we already provide a UIX example that shows how to connect a BI Graph bean to an XML data source. Now we have added a JSP example.
Using a very simple JSP page we can add a new BI Graph bean and render this with data from an XML data source. The code below shows the completed JSP page with all the require libraries and tags:

In this example the JSP page includes two key lines of code:
Line 1: helper.setGraphProperties(graph, "graph1.xml");
Line 2: helper.loadData(graph, false);
The first line sets the style properties for the graph. Below is the code used to load the style information and apply it to the graph:

For more information on setting the various graph properties and styles using the XML tags please refer to my previous posting “Beyond the BI Graph”. This can be found at the following URL:
http://all-siebel-info.blogspot.com/2008/05/beyond-bi-graph-wizard.html
The second line of code creates a connection to a non-OLAP data source for the graph and is contained within the same code library as the previous, code extract, GraphUIXSample.java. The loadData() method allows for two different types of connections. By passing the value of “false” as the last parameter the graph will be generated using data from an XML file, "helper.loadData(graph, false); ". This will call the following code:

This code loads an XML file that contains the following tags and data points:

which results in the following graph being displayed when the JSP is run:

By passing the value of “true” as the last parameter ( helper.loadData(graph, true) )the graph will be generated using data from a SQL statement. This will call the following code:

For this example we connect to the Scott schema and select data from the EMP table. The connection details to the instance are coded into this example; however, these could be stored and loaded from another file if required. Note here the lack of a BIDesigner connection, this is an area that also generates a lot of questions on the forum. There is no need to define a BIDesigner to make a non-OLAP connection. The connection is defined as per a normal ODBC connection.
The SQL statement is contained within a String object and is defined as follows:
String sqlQuery = "select DEPTNO, JOB, avg(SAL)from EMP group by DEPTNO, JOB";
Executing the query in a SQLPlus session will generate the following result:

The query results are assigned to an array called “data” using a “while” loop to walk-through the result set. To assign the data to the graph the setTabularData() method is called:
graph.setTabularData(data);
Running the JSP page now will generate the same style of graph as before, however, the data will now be sourced from the EMP table and will appear as follows:


0 comments:
Post a Comment